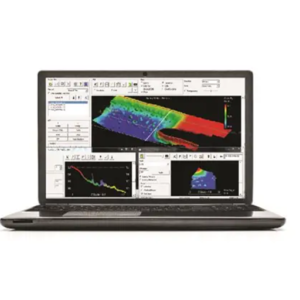
HYPACK® FOR HYDROGRAPHIC SURVEYING
HYPACK® is the most widely used hydrographic software package in the world with over 10,000 users around the globe. It provides all the necessary tools to complete your hydrographic, side scan, sub-bottom, and magnetometer survey requirements. With HYPACK®, you can design surveys, collect data, apply sounding corrections, remove outliers, plot field sheets, export data to CAD, compute volume quantities, generate contours, create side scan mosaics, and create and modify electronic charts.
MONITOR SHIPPING CHANNEL CONDITIONS
HYPACK® is commonly used to maintain shipping and boating lanes at specified depths to ensure safe passage of marine vessels. It provides hydrographic surveyors with the needed tools needed to design their survey, collect and process data, and present the data in a variety of output formats. Project plotting sheets, CAD chart files, cross sections, volume reports, and interactive 3D TIN models and point clouds all enable you to visualize the bottom surface in detail. Depth profiles can be compared to engineered channel design specifications, assuring adequate depths and continued coverage of structures such as pipelines and communications cables.
UNDERWATER SEARCH
HYPACK® includes a diverse range of tools that may be used to search for submerged objects. Survey draws data from bathymetric and side scan sonar in color-coded displays that provide real-time visualization of the underwater surface.
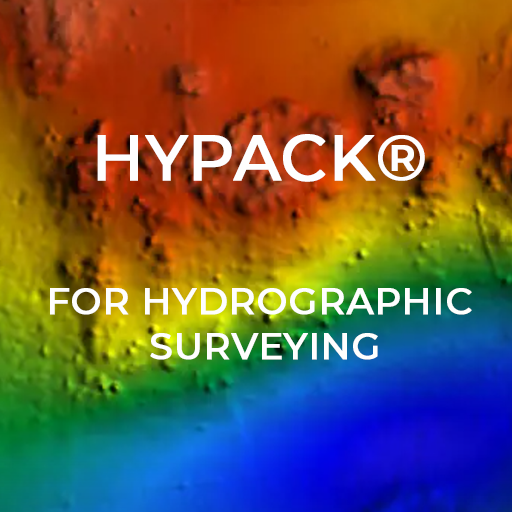
In 2014, HYPACK was honored to assist a team of international scientists in surveying the coast of Normandy, France to comemmorate the 70th anniversary of the D-Day invasion. Utilising the latest technologies and the world’s most advanced software, the team surveyed 511 square kilometers of sea floor, producing an enormous 11 TB of data. Employing HYPACK® hydrographic surveying software, the team was able to aggregate over 4 billion soundings from multi-beam sonar to produce very high resolution color 3D images of the seabed, revealing many remaining artefacts from the D-Day landings. Read more about this survey in HYPACK at Normandy Beach.
HYPACK® also supports search operations for smaller-scale objects by using survey data to look for objects of interest, then supporting the work of a dive team using the Diver6 system. Diver6 is a diver and dive operations mobile support system. This advisory system allows dive masters to monitor and track divers beneath the surface of the water for greater situational awareness. The system provides up-to-date information on divers in the water, allowing the dive master to make faster, safer, and more accurate decisions. All monitoring aspects of the dive are recorded and can be used later for analysis and auditing.
EROSION AND SEDIMENTATION STUDIES
HYPACK® may be used to study the rate of erosion and sedimentation in your project area. Use the tools in HYPACK® to compare multiple sets of survey data collected over time. The TIN MODEL module can draw overlapping surface models and calculate the volume of material from the first surface that falls above or below the surface of the second. Additionally, CROSS SECTIONS AND VOLUMES provides profile visualization of the data sets and a selection of volume calculation methods that compare the difference between the volumes and the channel design. Erosion and sedimentation data can be used for ecological studies or to predict the frequency and extent of work required to maintain waterways for boating traffic.
BEACH RECLAMATION PROJECTS
Beach reclamation is the act of restoring a beach from erosion. Sand is added to the area that was lost to erosion to “reclaim” the shoreline that once was or widen the existing beach. Reclamation does not just occur on ocean beaches but any beach or shoreline that is subject to severe erosion.
SUB-BOTTOM ID AND PROFILING
Sub-bottom identification approximates the granularity of surface sediments over your survey area based on the E1 and E2 ranges from Seabed ID systems. The Seabed ID device driver uses the Seabed ID Square during SURVEY, or during postprocessing in the SEABED STATISTICS program, to apply classification numbers for each sounding record according to the E1-E2 range in which it falls. You can use these Seabed ID numbers to color your matrix in SURVEY or HYPACK®, or plot your soundings and track lines in HYPLOT.
Sub-bottom profiling measures sedimentary layers below the surface layer. Sub-bottom profilers are used extensively in offshore, coastal, and port engineering and geotechnical site surveys; renewable energy surveys; dredging studies; mineral exploration; and habitat mapping projects. The data from these systems is used to interpret the thickness and qualitative sediment characteristics of the different sediment layers that comprise the sub-bottom strata.
ADCP
ADCP PROFILE displays color-coded flow data with the channel cross section. It can print or plot the resulting cross section graphs. The ADCP PROFILE program also creates textual discharge reports that you can save and print, and generate georeferenced DXF charts of your current vectors.
ADCP IN SITU analyzes data collected by a stationary Acoustic Doppler instrument. This type of project would monitor current, tide, salinity, and pressure at a set destination over an extended period of time. ADCP IN SITU reads data logged by Teledyne RDI, SonTek and Nortek (NDP or AquaPro) devices using their firmware. It then presents your data in a variety of displays where you can inspect and edit your data.
MAGNETOMETER
In the MAGNETOMETER EDITOR, you can use targets to mark anomaly locations and store detailed data about each anomaly. Magnetometer targets record the Peak Minimum and Peak Maximum (gamma) attributes and calculate the Peak Spread. When you have a target range marked, you can output the information to a RTF (Rich Text Format) report. This provides all of the statistical data about the selected data range and an optional screen capture of the WMA window.
Normalized magnetometer data can be effectively displayed as 2D contours generated in the TIN MODEL program. Contoured data clearly shows your monopolar and dipolar target areas.
HYPACK® FOR SINGLE BEAM SURVEYS
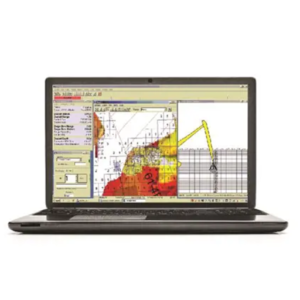
The HYPACK® SURVEY program provides you with the power and flexibility to quickly complete your survey work. SURVEY accepts input from GPS, range-azimuth systems, echosounders, magnetometers, telemetry tide systems, and over 200 other sensors. It also provides positioning data for our SIDE SCAN SURVEY program (a standard part of HYPACK®) and the multibeam HYSWEEP® SURVEY program (an optional module of HYPACK®).
The SURVEY program allows you to track multiple vessels. You can track your own survey vessel, or a vessel and a towfish, or a vessel and an ROV, or multiple vessels with the same easy-to-use program.

